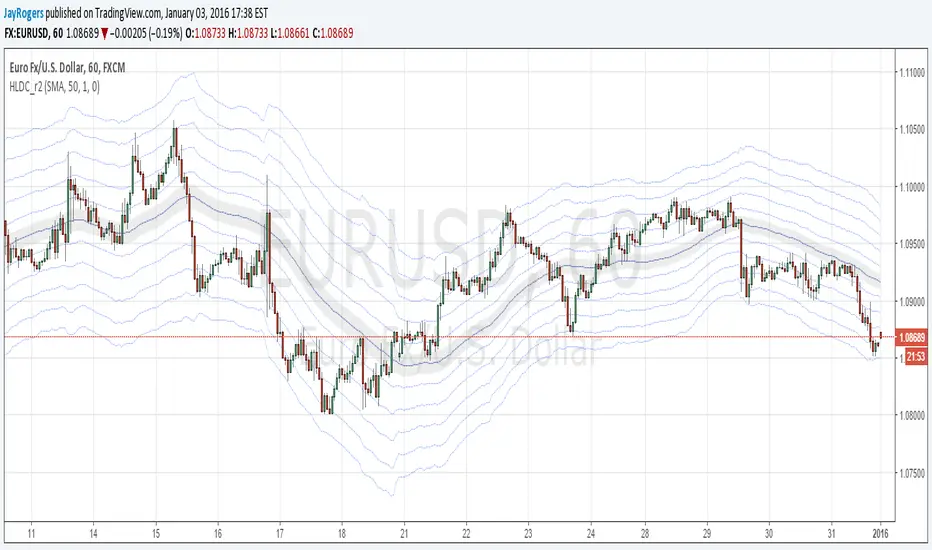
High-Low Difference Channels r2About:
I developed the original as an experiment to potentially replace or augment my BB and RSI based strategies. After some back-testing I could see some really interesting results but it wasn't quite where I wanted it, so after some tweaking and further back-testing, and adding in more MA options, here we are. Mostly tested on 1h and greater time-frames using default settings.
Description / Usage:
Adjust length and multiplier much the same way you would expect with Bollinger Bands.
Multiplier of 1 gives you a base channel consisting of one high, and one low sourced MA
The outer channels are increments of the base high-low channel width, away from the hl2 sourced MA
r2 Changes:
Increased amount of up/down channels to 5, and lowered multiplier default to 1 (previously 1.5)
Tweaked default colour scheme.
Pick your MA poison of choice! Added choices for all your common MA variants.
Issues:
VWMA bugs out and refuses to draw sometimes - no idea why.
Additional Notes:
All MA variants available in this script were derived directly from the sources of those available within the pine editor. I have been fairly diligent trying to ensure they all function correctly, but I can't 100% guarantee it, so if anyone gives the script a try, or dives into the code and see's something odd - don't hesitate to let me know!
It would also be fantastic to hear feedback from anyone who finds use for this, to augment an existing strategy/idea, or develop something new. :)
Cerca negli script per "high low"
High-Low Breakout Strategy with ATR traling Stop LossThis script is a TradingView Pine Script strategy that implements a High-Low Breakout Strategy with ATR Trailing Stop.created by SK WEALTH GURU, Here’s a breakdown of its key components:
Features and Functionality
Custom Timeframe and High-Low Detection
Allows users to select a custom timeframe (default: 30 minutes) to detect high and low levels.
Tracks the high and low within a user-specified period (e.g., first 30 minutes of the session).
Draws horizontal lines for high and low, persisting for a specified number of days.
Trade Entry Conditions
Long Entry: If the closing price crosses above the recorded high.
Short Entry: If the closing price crosses below the recorded low.
The user can choose to trade Long, Short, or Both.
ATR-Based Trailing Stop & Risk Management
Uses Average True Range (ATR) with a multiplier (default: 3.5) to determine a dynamic trailing stop-loss.
Trades reset daily, ensuring a fresh start each day.
Trade Execution and Partial Profit Taking
Stop-loss: Default at 1% of entry price.
Partial profit: Books 50% of the position at 3% profit.
Max 2 trades per day: If the first trade hits stop-loss, the strategy allows one re-entry.
Intraday Exit Condition
All positions close at 3:15 PM to ensure no overnight risk.
highs&lowsone of my first strategy: highs&lows
This strategy takes the highest high and the lowest low of a specified timeframe and specified bar count.
It will then takes the average between these two extremes to create a center line.
This creates a range of high middle and low.
Then the strategy takes the current market movement
which is the direct average(no specified timeframe and specified bar count) of the current high and low.
Using this "current market movement" within the range of high middle and low it determins when to buy and then sell the asset.
*********note***************
-this strategy is (bullish)
-works good with most futures assets that have volatility/ decent movement
(might add more details if I forget any)
(work in progress)
High Low Open Mid Ranges & Levels (Multi-Timeframe)This indicator automatically plots the chosen timeframe's high, low, mid point and open. These levels on higher timeframes act as support and resistance levels on lower timeframes, helping find entries, stoploss and profit targets.
Most common timeframes to choose are Daily, 1W, 1M, and 3M. Other timeframes that are good include, 2D, 2W and 2M.
For example, you can see in the snapshot below, we are on the 4hr TF showing those levels from the 2W. This historical 2W zone (open and mid) was (and currently still is) resistance. You can see it also provided a good entry to go short.
This is also useful for intraday scalping. Below, we are on the 15min TF with levels set on the 2D timeframe. You can see how the Open and Mid levels acted as resistance, providing good entries on range trades, with take profit set at the previous 2D low.
There is also a table which tells you all the main TFs high, low, open, and mid levels. They are the most important ones to look out for.
This indicator should not be used in isolation; it is best to pair it up with other TA such as orderblocks, S/D zones, S&R or overlay indicators.
High Low Rate Of ChangeAn experimental indicator using Pine Script Arrays. The indicators measures the rate of change of the highest highs and lowest lows. I call it the "High Low Rate of Change".
The H/L Rate of Change indicator finds the delta between the current highest high and previous highest high and after some filtering places these values into an array.
Same goes for the lowest lows.
In the end Sum it all up into the Histogram with optional smoothing using Exponential moving average (EMA).
==Colors==
Green: Up Trending.
Light Green: Weakening up trend.
Red: Down Trending.
Light Red Weakening Down Trending.
==Notes==
Bar colors are disabled by default.
Supports EMA smoothing (enabled by default).
Like if you Like and Enjoy!
Follow up for upcoming indicators: www.tradingview.com
High/Low/Open/Close Daily, Weekly, Monthly Line
I wrote this for the purpose of saving time while marking up charts by automating the process of drawing and labeling lines at areas of interest on larger
timeframes while still having the option to change the style and size of the lines and labels to adjust for any timeframe and avoid a messy chart.
I also used this as an exercise in menu organization giving users every imaginable option and producing clean readable code.
- This indicator draws a line on the Daily, Weekly, and Monthly bar at the High, Low, Open and Close of each bar as price
tends to react when revisiting these areas.
- Each set of bars has an optional identifying label with its own color set that can be shown with or without the lines
price value, and has drop down menus for size and style of each set of labels.
- Each set of lines has inputs for line/text color, line width and style, and can be hidden if the user doesn't have the need for any particular timeframe.
- Lines and Labels with delete when a new line is created.
- I recommend going into Chart Settings/Status Line and turning off indicator arguments OR moving the script to the top
of the indicator list to avoid an obstructed chart view with this indicators arguments. When Pine allows, I will update it to hide them.
Contains some public domain code from T.V. manuals and tutorial for creating drop down input menus for options.
/ ~For My Pal Jittery~
~ Who likes his clean chart and custom colors~
High-Low RangeThis script just shows a histogram of the daily range. You can change the interval to view the high/low range of any period, but I use it just to see what the day's range is and how it compares to prior days. Simple and straightforward.
Pi - Intraday High-Low Predictor
This is not my Strategy/Research , I've just coded it into a indicator.
I found it interesting & useful so I'm sharing it here.
This Strategy/Research is by Kshirod Chandra Mohanty ( y-o-u-t-u-b-e : Trade with IITIAN )
You can watch his video on y-o-u-t-u-b-e for more info on this one.
the video has following title :
"1Cr Paid Strategy For Free || 10000 Subscribers Special Giveaway || How to find Day High or Low"
This will not tell you which is day high or day low, but it will help you to predict the day high from a day low and day low from a day high.
It will give you a possible range to which the prices could move to.
He has explained/used this on Banknifty.
How to Find out Day High from Day Low & Day Low from Day High :-
He uses the value of Pi (3.14) and the Range of 1st 5minute candle to find out the possible highs from day low and the possible lows from day high.
Range = value of Pi * 1st 5minutes Range
Small range = Range / 2
Large range = Range + Small range
so to find out the possible lows from day high we do following calculations
Small range low = day high - Small range
Range low = day high - Range
Large range low = day high - Large range
and to find out the possible highs from day low we do following calculations
Small range high = day low + Small range
Range high = day low + Range
Large range high = day low + Large range
Note :- This Indicator does Repaint in following ways,
As the script uses the Day High to predict the possible lows ,
so if it's an up-trending day and price keeps on making new High's then the ranges for lows will keep on changing.
similarly the script uses the Day Low to predict the possible high's ,
so if it's an down-trending day and price keeps on making new Low's then the ranges for highs will keep on changing.
My observations / thoughts about this :-
This script does not provide buy/sell recommendations. it just provides possible ranges to where prices can go from Day-High & Day-Low.
It's better to avoid trading when the price is trading between the Small range high & Small range low levels.
As it has high probability that it will be a range bound day and price will stay in between those two levels.
There is a high probability that it will be a trending day if price breaks either the Small range high/low ,
then the price could move to Range low/high.
If price breaks from Range High/Low then there is a high probability that it will be a trending day and the price could move to Large Range low/high.
Note :- If you want to use this on instruments/scripts/indexes which are active for large session such as forex/cryptos , then i suggest that you use the Opening Range period of 4Hours i.e 240minutes, to get better results.
using the default setting of 5minutes will not give good results on them.
play around with this value to find out which one suits that instrument/script/index the best.
Don't trust these levels blindly, do backtest or live testing of this then use for real trade if you want.
Use Price action near these levels to make any trading decision's.
The script provides following options :
1. Option to display Ranges in a Table (which you can enable/hide as you wish)
You can set the Table's location, size , background color & text color according to your preference.
2. Option to enable/hide Predicted-Highs from Day-Low on chart.
3. Option to enable/hide Predicted-Lows from Day-High on chart.
4. Option to set the Opening range period - here you can select your preferred opening range for calculation purpose.
5. Option to enable/hide historical levels on chart.
6. Options to customize the colors & line styles for lines.
7. Options to customize the colors , position & size for labels.
Ultra High/LowThe Ultra High/Low script helps traders track key price levels by automatically marking significant highs and lows on a chart, highlighting potential reversal points for future trading decisions.
Introduction
The Ultra High/Low script identifies and marks significant highs and lows on a trading chart. These are specific points where the price reached a peak or bottomed out before reversing. The script draws lines at these levels, which can be extended, and it also labels the exact price at these points. This makes it easy for traders to see where the price has changed direction previously, helping them make more informed trading decisions.
Detailed Description
In more detail, the Ultra High/Low script is designed using Pine Script™, a programming language used for creating custom indicators and strategies on the TradingView platform. Here's how it works:
..........
Detection of Pivot Highs and Lows
The script identifies "pivot highs" and "pivot lows." These are points on the chart where the price reached a local maximum or minimum, surrounded by lower highs (for pivot highs) or higher lows (for pivot lows).
The user can customize how many bars to the left and right of the high or low the script should consider to confirm a pivot (Length argument in the settings).
The script uses Pine Script functions for pivot detection. ta.pivothigh() and ta.pivotlow() .
......
Drawing Lines and Labels
Once a pivot is identified, the script draws a dashed line from the pivot point to the current price bar. This line helps visualize where significant price reversals have occurred.
The script also adds a label next to these lines showing the exact price of the pivot point. This label also shows "PDH" (Previous Day High) or "PDL" (Previous Day Low) if the pivot is PDH or PDL. Same for "PWH" (Previous Week High) and "PWL" (Previous Week Low).
......
Purging and Extending Lines
If the price crosses a pivot line after it has been drawn, the script can either delete the old line (purged line) or keep it and add additional indicators to show that the line has been liquidated.
The script also has options to extend the lines into the right.
......
Custom Inputs
The script offers several customizable options, like the color of the lines and labels, whether to show the exact price or not, and whether to extend the lines. This allows traders to tailor the indicator to their specific needs and preferences.
..........
Overall, the Ultra High/Low script is a powerful visual aid for identifying critical price levels that may influence future price movements, making it easier for traders to make decisions based on historical price behavior.
Previous Highs + Lows by HAZED📈 Introducing: Previous Highs + Lows by H A Z E D 📉
✨ Overview
Get a clear view of market levels with Previous Highs + Lows v1.0! This indicator lets you track critical previous highs and lows across multiple timeframes, marking them directly on your chart for an intuitive view of support and resistance zones. Whether you’re analyzing breakouts or looking for reversal levels, these indicators provide essential context to refine your trades.
🛠️ Key Features
Multiple Timeframes Supported
Toggle on previous highs and lows for daily, weekly, monthly, 4-hour, and 1-hour charts to match your analysis style.
Customizable Labels
Choose label sizes from “tiny” to “huge,” adjust the opacity to blend seamlessly with your chart, and customize text color for optimal readability.
Label Position Control
Avoid overlap with a flexible label offset feature, allowing for 10 adjustable increments to fit your preference and chart layout.
Clear Visual Cues
Labels use icons to differentiate high (⬆️) and low (⬇️) levels at a glance, providing a straightforward way to interpret key price areas.
Instant Alerts for Key Levels
Receive alerts when the price crosses over previous high levels, keeping you informed about potential breakout zones without constant chart-watching.
🚀 How to Use
Identify Key Levels: Quickly locate significant highs and lows from previous periods to define your support and resistance zones.
Set Alerts: Stay updated on market moves with built-in alerts when prices cross these critical levels.
Customize Your View: Use the various options to make this indicator uniquely yours – adjust label size, color, opacity, and position.
🔔 Why Use Previous Highs + Lows v1.0?
Enhanced visibility of critical levels saves you time by giving you a structured view of price action.
Customization features let you adapt the indicator to your personal style and chart setup.
Flexible alerts mean you can focus on other tasks without missing important price movements.
🔗 License: Mozilla Public License 2.0
© H A Z E D, 11/4/2024
Prior day and pre-market high lowThis indicator displays the:
- Prior day high
- Prior day low
- Pre-market high
- Pre-market low
as a coloured line across the entire session for each individual session on an intraday chart.
For the extended session, this indicator marks the prior day and pre-market high low for each individual session starting at the pre-market and ending in the post-market, a feature not available on other indicators.
This indicator automatically marks out the levels for the prior day and pre-market high low for each individual session, allowing the user to observe how the price action behaves around the prior day and pre-market high low.
Note:
In this script, request.security() used with lookahead = barmerge.lookahead_on to fetch prices without offsetting the series by for the extended session does not access future data. This is because for extended session, request.security() sees the start of the session to be at the start of the regular session and ends at the end of the pre-market, when in reality the session starts at the start of the pre-market and ends at the end of the post-market.
Hence in each extended session when the line is first drawn in the pre-market, request.security() returns the value of the prior day high/low, and not future data.
4C Daily Levels Suite + Premarket High/LowThis '4C Daily Levels Suite + Premarket High/Low' indicator is a clean way to automatically plot important daily levels including:
Prior Day High
Prior Day Low
Prior Day Close
50% level between Prior High/Low
Today's Open
Today's Premarket Low+High
This Daily Levels indicator is unique in its ability to:
-Plot all of the daily level PLUS premarket high/low levels (extended hours must be turned ON)
-Can hide past days levels, only plotting levels on the current day, to keep chart cleaner
-Can extend line levels right or fullscreen
-Plots the level price at each level on the chart
-Can show/hide price levels labels
-Can add supplemental premarket levels plot to show levels being formed during the premarket time period
-Coded with line.new vs plot so dashed lines are available as a style
-Automatically hides the indicator if the timeframe selected is Daily or greater
SEE SCREENSHOT EXAMPLES BELOW
Default mode, with extended hours showing:
With supplemental premarket plot showing:
Default mode without extended hours showing:
Showing past day’s levels
Extend lines to fullscreen
Some parts of this code were adapted from 'pd Levels' by CryptoCurl
Extended Session High/Low - Intraday and daily chartsThis script plots the extended session highest high and lowest low levels. It works on any time frame from 1 minute to daily.
Please note that during the extended session, TradingView stops updating the daily chart. This means that once the script is loaded on a daily chart, it will not be updated until the market opens, unless you manually reload the layout (Ctrl+R). For this reason, it is recommended to use a multi-timeframe layout, so when the pre/post market line is near the extended session high/low on the daily chart, you can compare these values with those on an intraday chart of the same ticker.
The extended session high/low are important for day traders because they represent the maximum and minimum limits within which the trades have taken place during the extended trading hours. This can make them levels of support/resistance that can be useful for planning trend following, reversal and range-bound strategies.
By displaying the extended session high/low on the daily chart, traders can also see if there are any significant levels nearby that are related to the daily time frame, such as trendlines, support/resistance levels, or moving averages. This can help the trader evaluate whether there is enough room for a price movement in the direction of his trading strategy.
MTF High LowThis is a Multi-Time Frame High Low Indicator that plots the highest and lowest price levels of the chart timeframe and a user selected higher timeframe.
The length can be optimized by the user from settings (default value is 6 candles) and table position can also be adjusted.
The calculation does not takes into account the last candle price data to form a view using the current close price as described below:
If Close > mid value of High + Low, view is Bullish
If Close < mid value of High + Low, view is Bearish
The above is also calculated for the higher timeframe and view for both timeframe is updated in the chart.
The color coding is dynamic based upon the current close price levels and comparisons with High, Low and Mid values.
The mid values level plot is hidden by default and can be enabled and saved as default if the user likes so.
52 Week High/Low52 Week High / Low Indicator
A simple, unobtrusive indicator that can be used on any timeframe to display the 52 week high/low values.
Features
Works on any timeframe.
Unobtrusive: Simple horizontal lines showing only the current 52 week values.
Allows the user to select whether to calculate the 52-week values from candle close values or the respective highs/lows.
For full overview and code commentary - Visit the backtest-rookies website.
Rets High/Low (2.0 Special Uncensored Edition)This script can be used as a visual aid in seeing the last highs and lows of price in a specific time period. It automatically updates the plots if new highs or lows are made within the given lookback period.
This is a fairly basic version currently, with new added features coming in future updates such as range between high/low and half and whole number detection.
Daily HIGH/LOW strategyThis is a DAILY High/LOW strategy combined with a moving average and volume for more accuracy.
The rules are simple :
For long if we had a cross of the high with the previous high and close of the candle is above moving average and chaikin money flow volume is positive we have a long entry.
We exit when we cross down the moving average with the close of the candle.
For short if we had a crossdown of the low with the previous low and close of the candle is below moving average and chaikin money flow volume is negative we have a short entry.
We exit when we cross above the moving average with the close of the candle.
This strategy has no risk management inside so use it with caution.
If you have any questions, let me know
Futures Open/High/Low TablesAdds (up to) 3 tables to a chart, displaying Open/High/Low data for today (RTH and extended hours), yesterday, and the current week / month -- to help with intraday analysis of a futures ticker.
The tables only appear on intraday charts (5min, 30min, etc). On a Daily/Weekly/etc chart they are not calculated or shown.
In addition to Open/High/Low, the "Current" table in the top-right shows a live measurement of # of points from the open, the RTH open, and the highs/lows.
Lastly, the 9:30am ET open and the 4pm RTH close are by default marked with a shaded background (on intraday charts) for easy visual reference, and also to help with adjusting the session time to accommodate time zone issues if they occur.
Tested on ES in Eastern Time Zone, but should work on any futures instrument and any time zone by adjusting the Session Time setting.
Extension of High, Low and InbetweenThis script plots an extension my other script High, Low, Inbetween.
It sometimes makes it difficult to view the candles effectively so I've added this separately to my other script
It calculates the range between high/low and midpoint.
It then plots these lines as extensions from the high and low.
This is done twice.
Multiple SMAs + X-Bar High/LowWhen starting my daily analysis, I typically open a daily chart and check where the price is compared to several SMAs, as well as check the high/low of today and the 10-day high/low. This indicator was designed to save chart space as well as make finding the highs and lows more efficient. Everything is adjustable, so you don't have to stick with my 10-bar rule.
Sector High/LowHighlights which S&P SPDR Sector ETFs are at highs of day (green letter) or lows of day (red letter)
The first candle of the day is always all-green because by default the first candle of the day has the high of the day. So this indicator is more meaningful later in the day when sectors are making repeated highs/lows
Fib High Low PointsThis is a simple indicator which plot high and lows based on Fibonacci sequence.
Best part of this indicator is it don't rewrite itself once it got plotted on the chart, which make it unique from other High low indicators.
Kozlod - All-time high/low alertsA small script to track all-time high/low levels.
You can create alerts when levels will be updated.